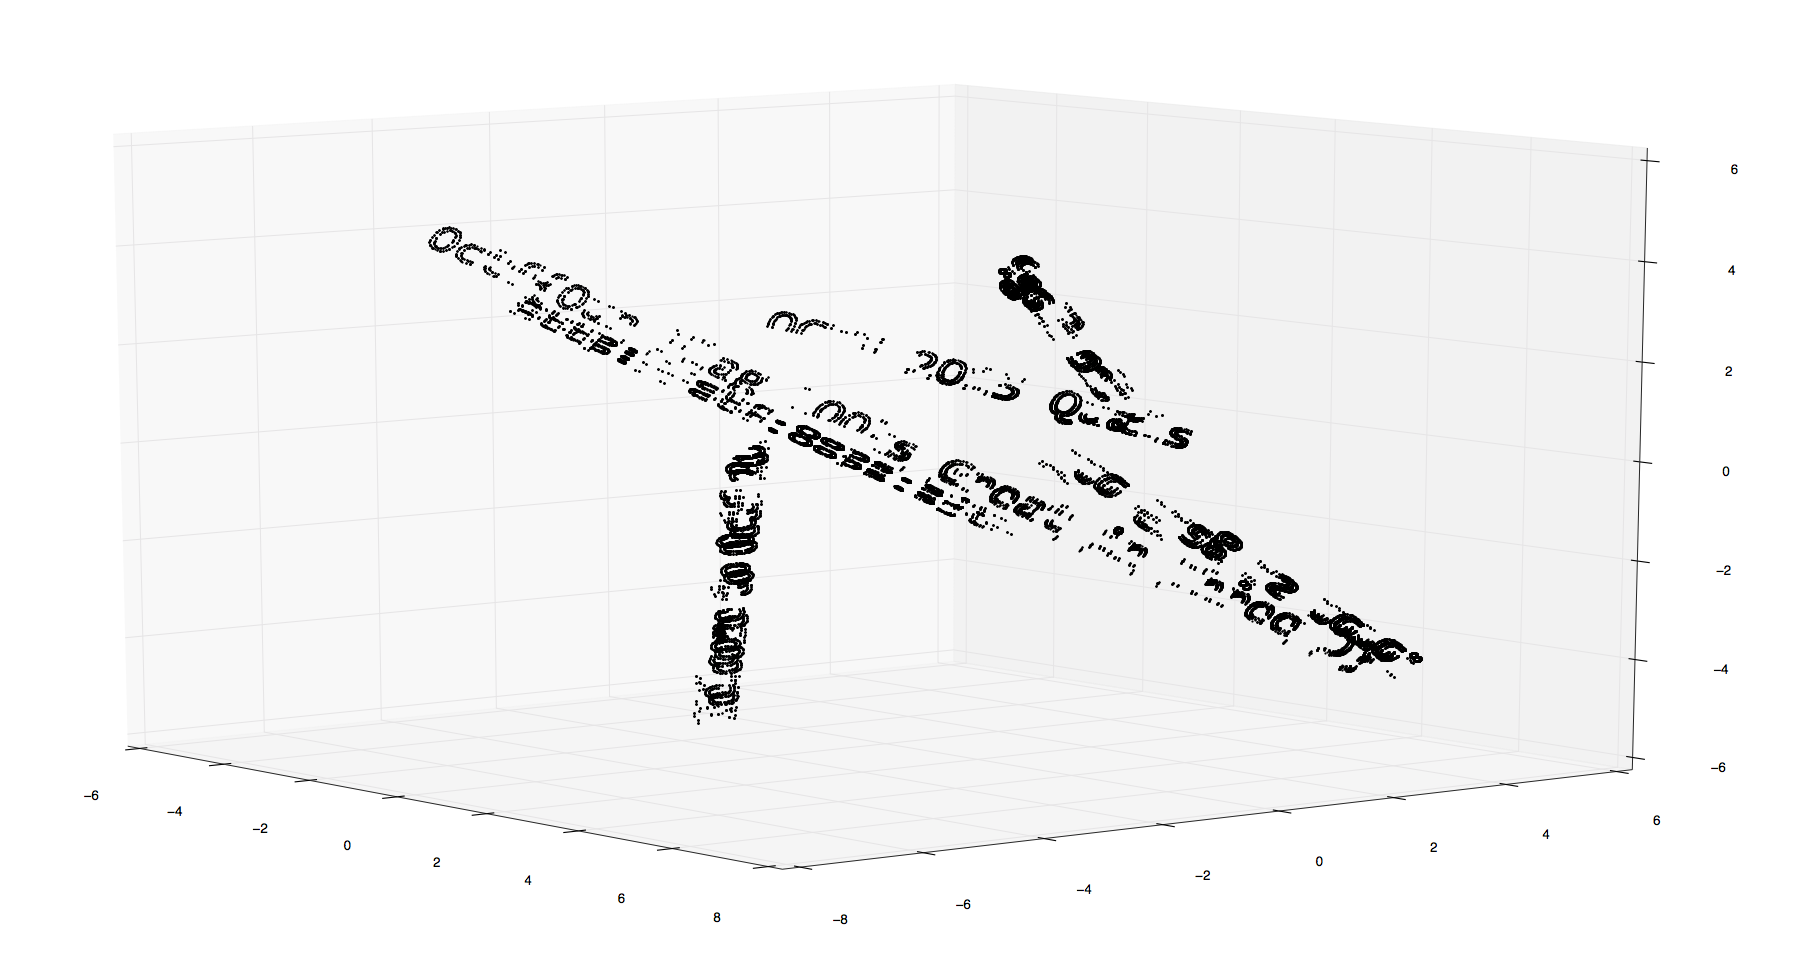
We are given thousands of 3D coordinates in a text file:
-4.751373,-2.622809,2.428588;-4.435134,-3.046589,2.406030;-4.788052,-2.661979,2.464709
-4.692748,-2.599611,2.629112;-4.656070,-2.560445,2.592991;-4.788052,-2.661979,2.464709
-4.692748,-2.599611,2.629112;-4.788052,-2.661979,2.464709;-4.435134,-3.046589,2.406030
-4.656070,-2.560445,2.592991;-4.516017,-2.714652,2.570303;-4.751373,-2.622809,2.428588
-4.656070,-2.560445,2.592991;-4.751373,-2.622809,2.428588;-4.788052,-2.661979,2.464709
-4.611258,-2.777269,2.405960;-4.435134,-3.046589,2.406030;-4.751373,-2.622809,2.428588
-4.572725,-2.644557,2.333280;-4.603014,-2.680354,2.364417;-4.592222,-2.663824,2.351891
-4.571442,-2.773632,2.381504;-4.564917,-2.826000,2.397583;-4.611258,-2.777269,2.405960
-4.571436,-2.742115,2.369542;-4.571442,-2.773632,2.381504;-4.611258,-2.777269,2.405960
-4.571436,-2.742115,2.369542;-4.611258,-2.777269,2.405960;-4.567214,-2.723559,2.360054
-4.567214,-2.723559,2.360054;-4.611258,-2.777269,2.405960;-4.560604,-2.711404,2.351613
-4.564917,-2.826000,2.397583;-4.435134,-3.046589,2.406030;-4.611258,-2.777269,2.405960
-4.560604,-2.711404,2.351613;-4.611258,-2.777269,2.405960;-4.614635,-2.748184,2.396883
...
...
If we represent them with matplotlib using somrthing like:
from matplotlib import pyplot
import pylab
from mpl_toolkits.mplot3d import Axes3D

x_vals = []
y_vals = []
z_vals = []

data = open("x-y-z", "r").readlines()
i = 0
for line in data:
	points = line.split(";")
	for point in points:
		point = point.replace("\r\n","").split(",")
		i += 1
		x = float(point[0])
		y = float(point[1])
		z = float(point[2])
		if i % 1 == 0:
			if (y//x) < 1.1 and (y//x) < 0.9:
				x_vals.append(x)
				y_vals.append(y)
				z_vals.append(z)

print len(x_vals)
fig = pylab.figure()
ax = Axes3D(fig)
ax.scatter(x_vals, y_vals, z_vals, zdir=u'z', s=1, c=u'blue', depthshade=False)
pyplot.show()
We get a nice 3D flag that we need to rotate, zoom and waste our eyes to finally get the flag.

FLAG: 0ctf{0ur_Flag_L00ks_Great_in_Three_D} (Thanks Mathias)